Pay gaps and workforce representation report: December 2024
This report provides information on our gender and ethnicity representation, and the pay gaps that exist. This report will be updated annually.
Summary
Slight increase in pay gaps
Gender
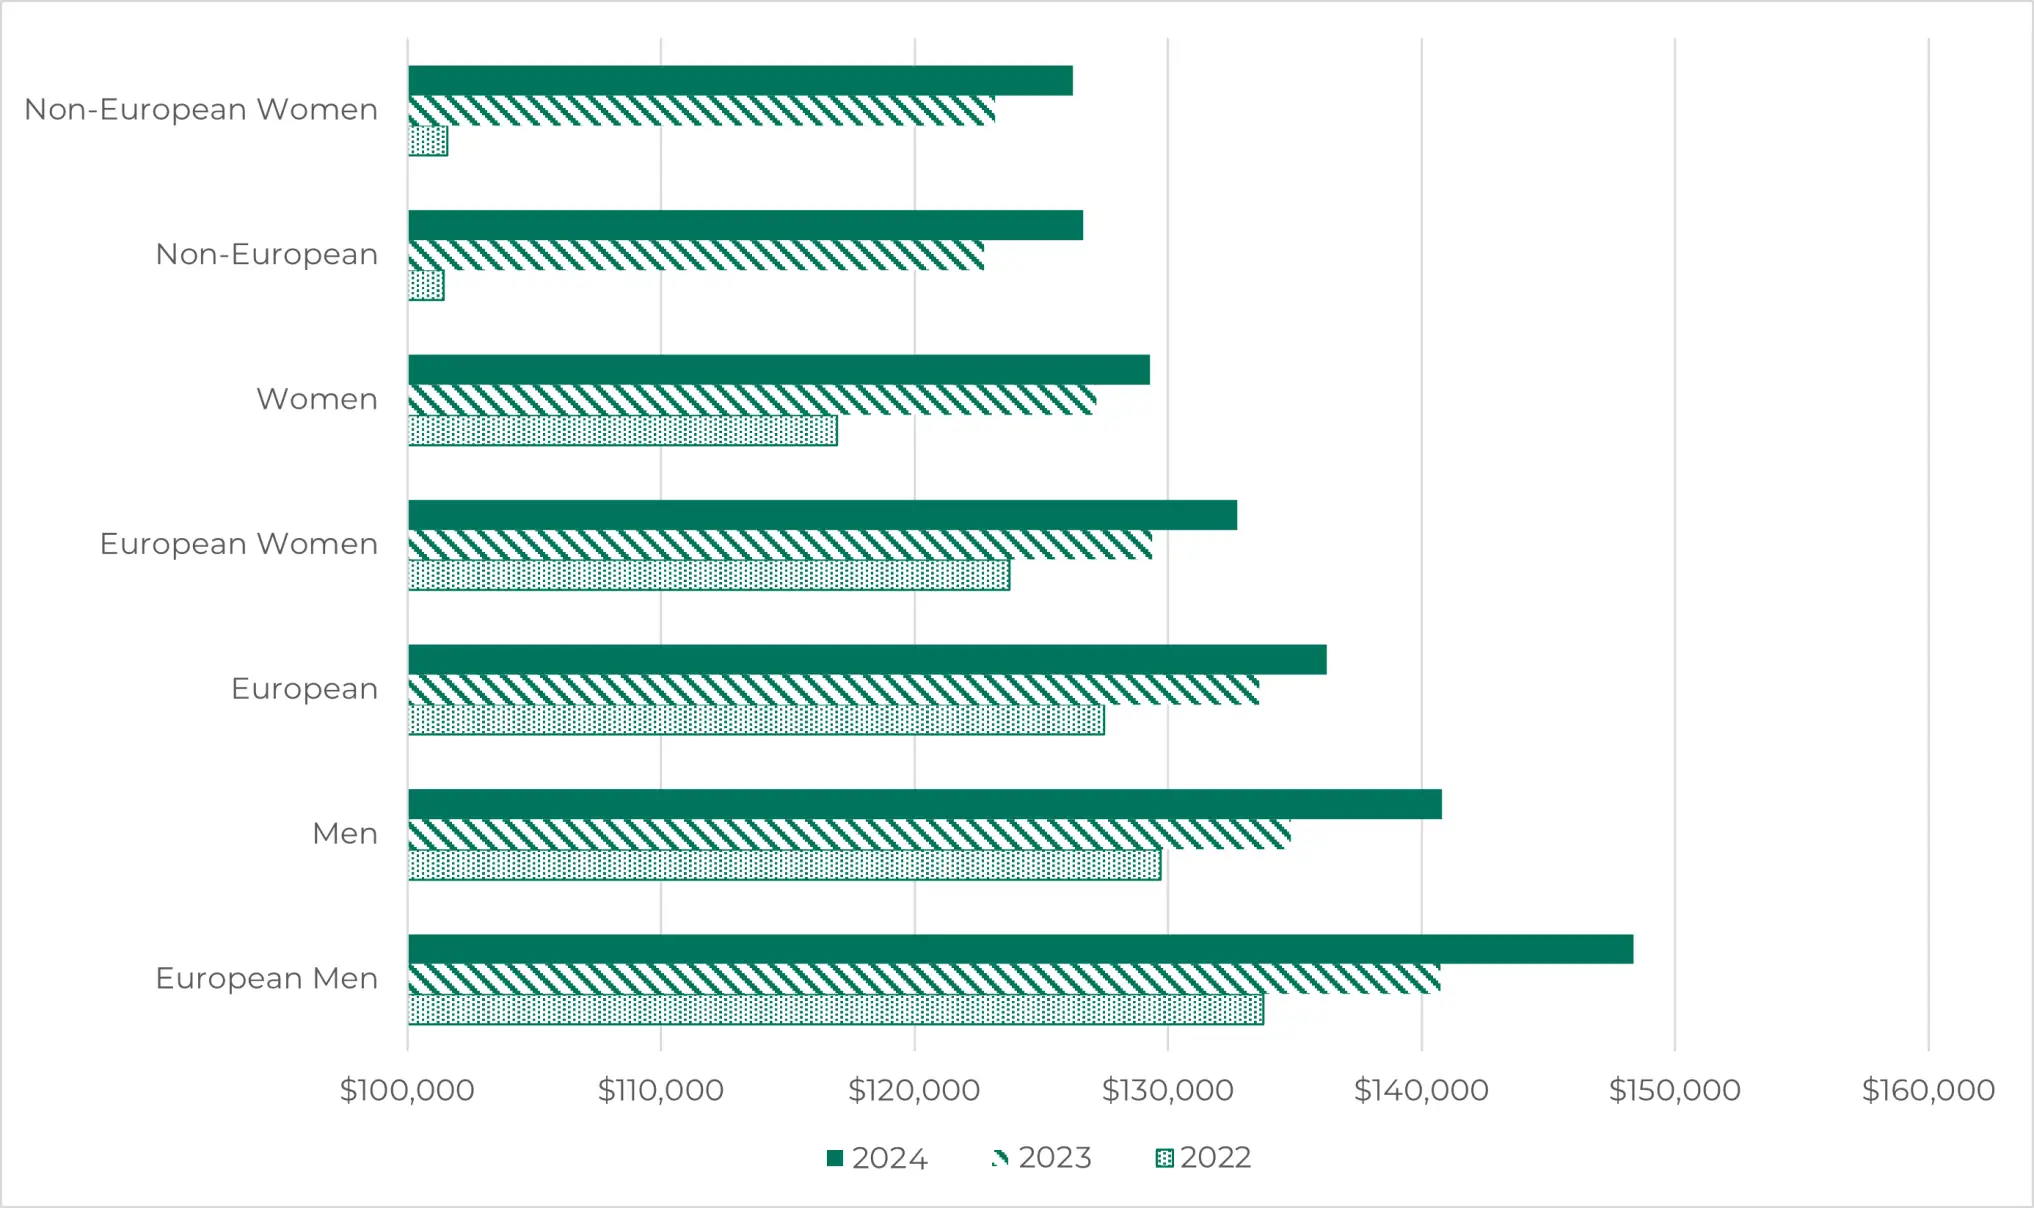
As of the latest assessment December 2024, our overall gender pay gap has increased slightly from 6% to 8% compared to December 2023.
The primary contributor to our gender pay gap remains the overrepresentation of women in lower pay band roles, coupled with a higher proportion of men in senior, higher-paid positions.
Ethnicity
A similar trend is observed in our ethnic pay gaps, with the Euro-Non-European pay gap rising from 12% to 13.9%. Our ethnicity pay gap is largely driven by the underrepresentation of minority groups in leadership and higher pay band roles.
Equity within bands improving
Despite these increases, we have made notable progress in reducing the average gender pay gap within pay bands, which has decreased from 0.7% to 0.23%.
Leaders from culturally diverse communities increased
Our commitment to enhancing workforce diversity and leadership representation continues to show positive results. The representation of leaders from culturally diverse communities has increased from 15% to 20%, and the representation of Pacific Peoples has grown from 2% to 3%. However, we did not meet our goal of increasing the percentage of kaimahi Māori, with representation remaining at 9%.
Creating a diverse workforce and closing pay gaps
We remain dedicated to eliminating pay gaps and working towards our workforce reflecting the diverse population of New Zealand. Due to the size of our organisation, even minor changes can significantly impact our pay gap statistics.
To drive meaningful progress, we have identified key opportunities for improvement:
- Enhanced Pay Transparency: Ensure consistent use of pay analysis tools to inform equitable starting salaries.
- Representation Growth: Increase the diversity of our workforce to represent the communities we serve.
- Leadership Representation: Focus on increasing the diversity of our people leaders to represent the communities we serve.
By continuing to implement these strategies, we are confident in our ability to create a more diverse, inclusive and equitable workplace for all.
About this report
Unless otherwise stated, the data includes both permanent and fixed-term employees and is as of December 2024. This report will be used to guide the update of our pay gap and representation action plan, June 2025.
Kia Toipoto – The Public Service Pay Gaps Action Plan(external link)
Our people
Total employees: 186
|
EMPLOYMENT STATUS |
WOMEN |
MEN |
NOT DISCLOSED |
|---|---|---|---|
|
Permanent |
102 |
48 |
11 |
|
Fixed-term |
14 |
8 |
3 |
|
Full-time |
109 |
53 |
14 |
|
Part-time |
7 |
3 |
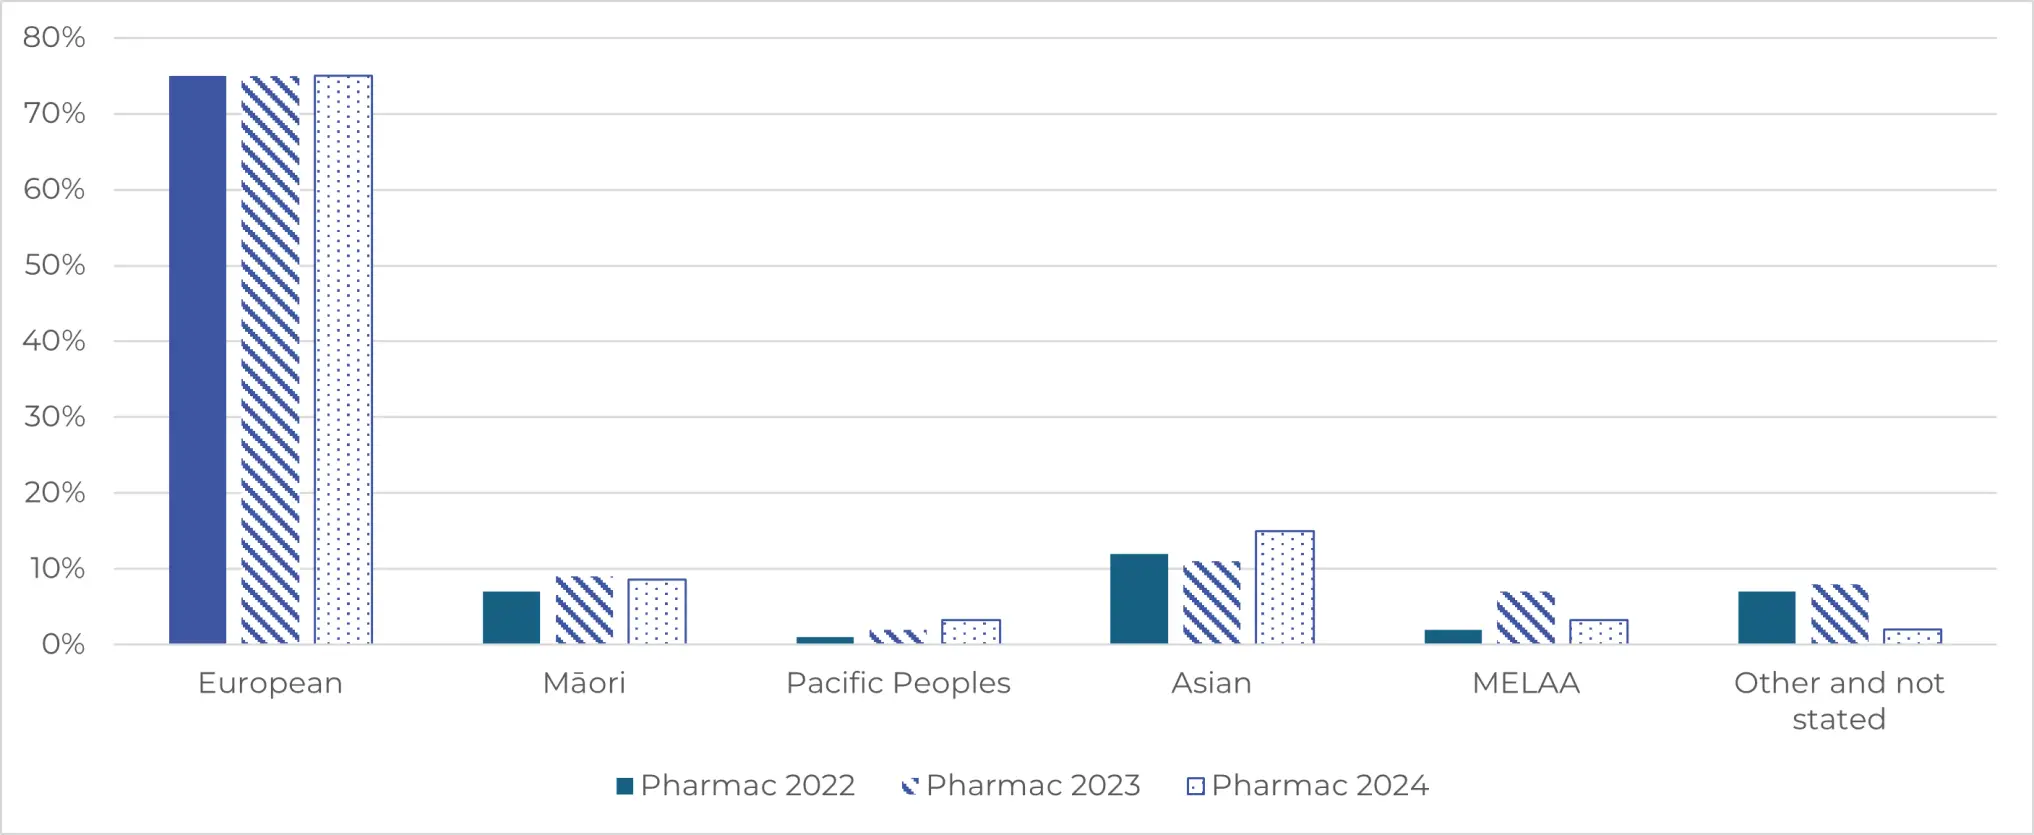
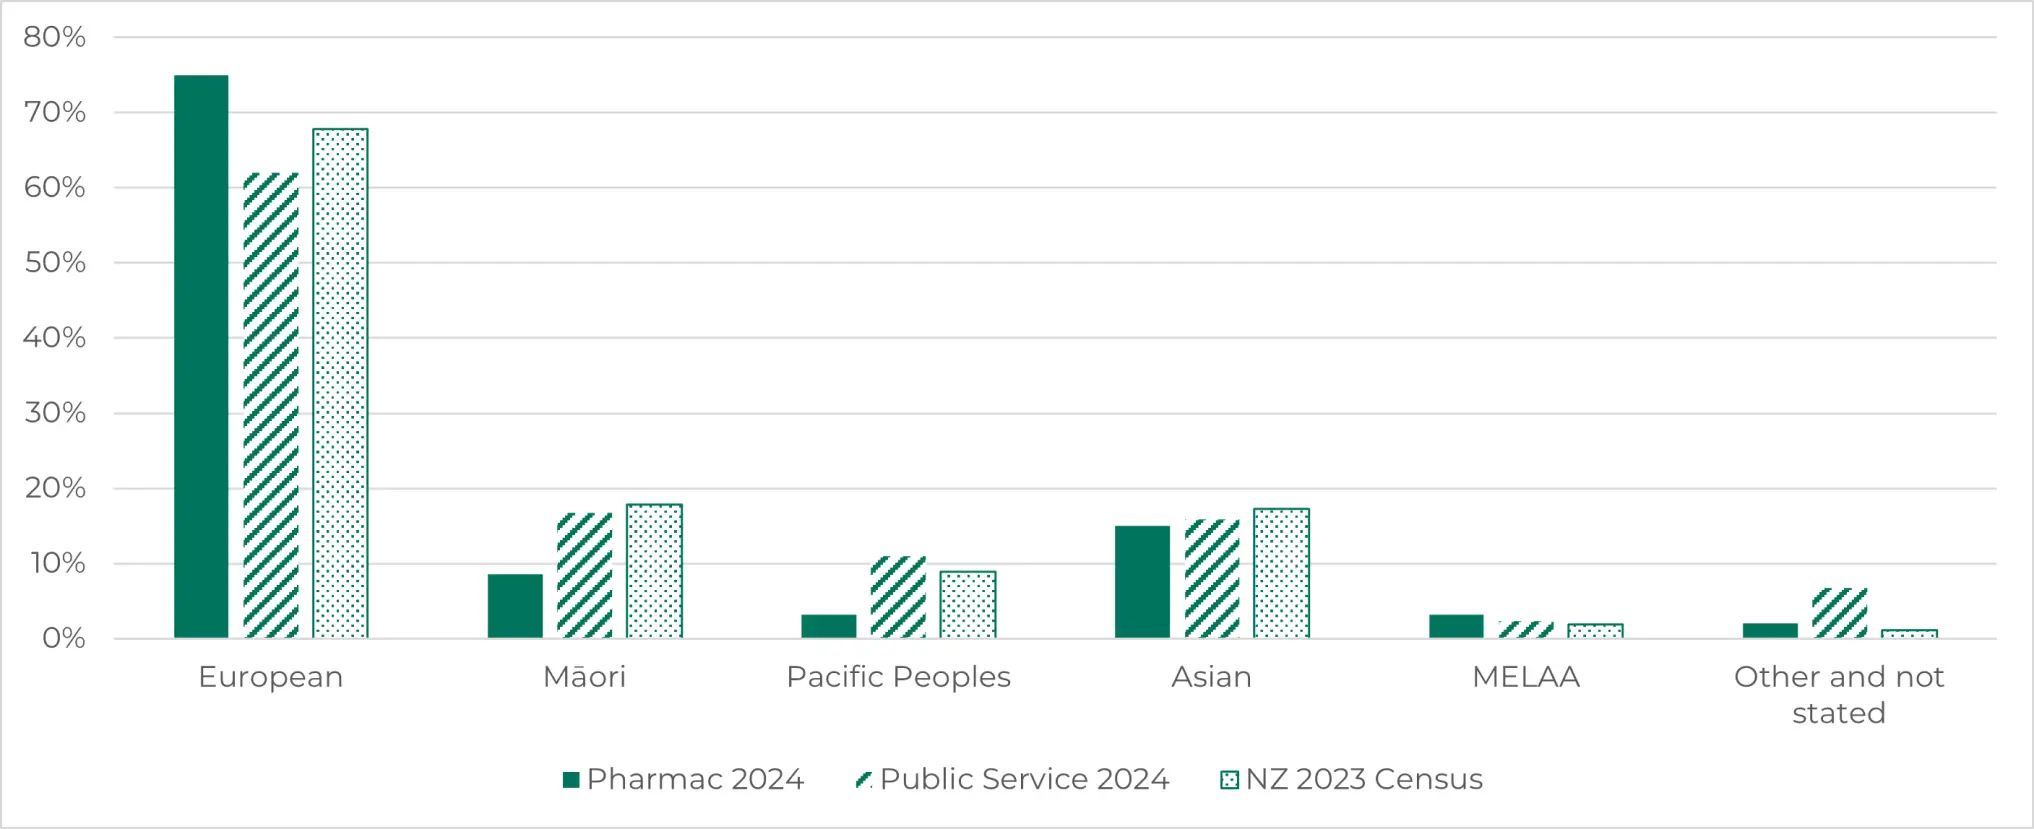
Pharmac ethnicity
We have a 98% ethnicity declaration rate. We have used a total response reporting method. This means people can appear more than once in our reporting, so ethnic group totals will add up to more than 100 percent of staff.
Pay gaps
We calculate gender pay gaps as recommended by Te Kawa Mataaho Public Service Commission, the % difference in the average pay for women and men using full-time-equivalent total remuneration. Ethnicity pay gaps are also calculated using average pay.
Due to our small size, we are only able to report our gender and non-European/European ethnicity pay gaps, however we conduct a thorough review of our pay gaps at least annually
Our Gender Pay Gap (GPG) is 8% | Our adjusted GPG by level is 0.2%.
Our ethnicity pay gap between Europeans and other ethnicities is 13.9%.
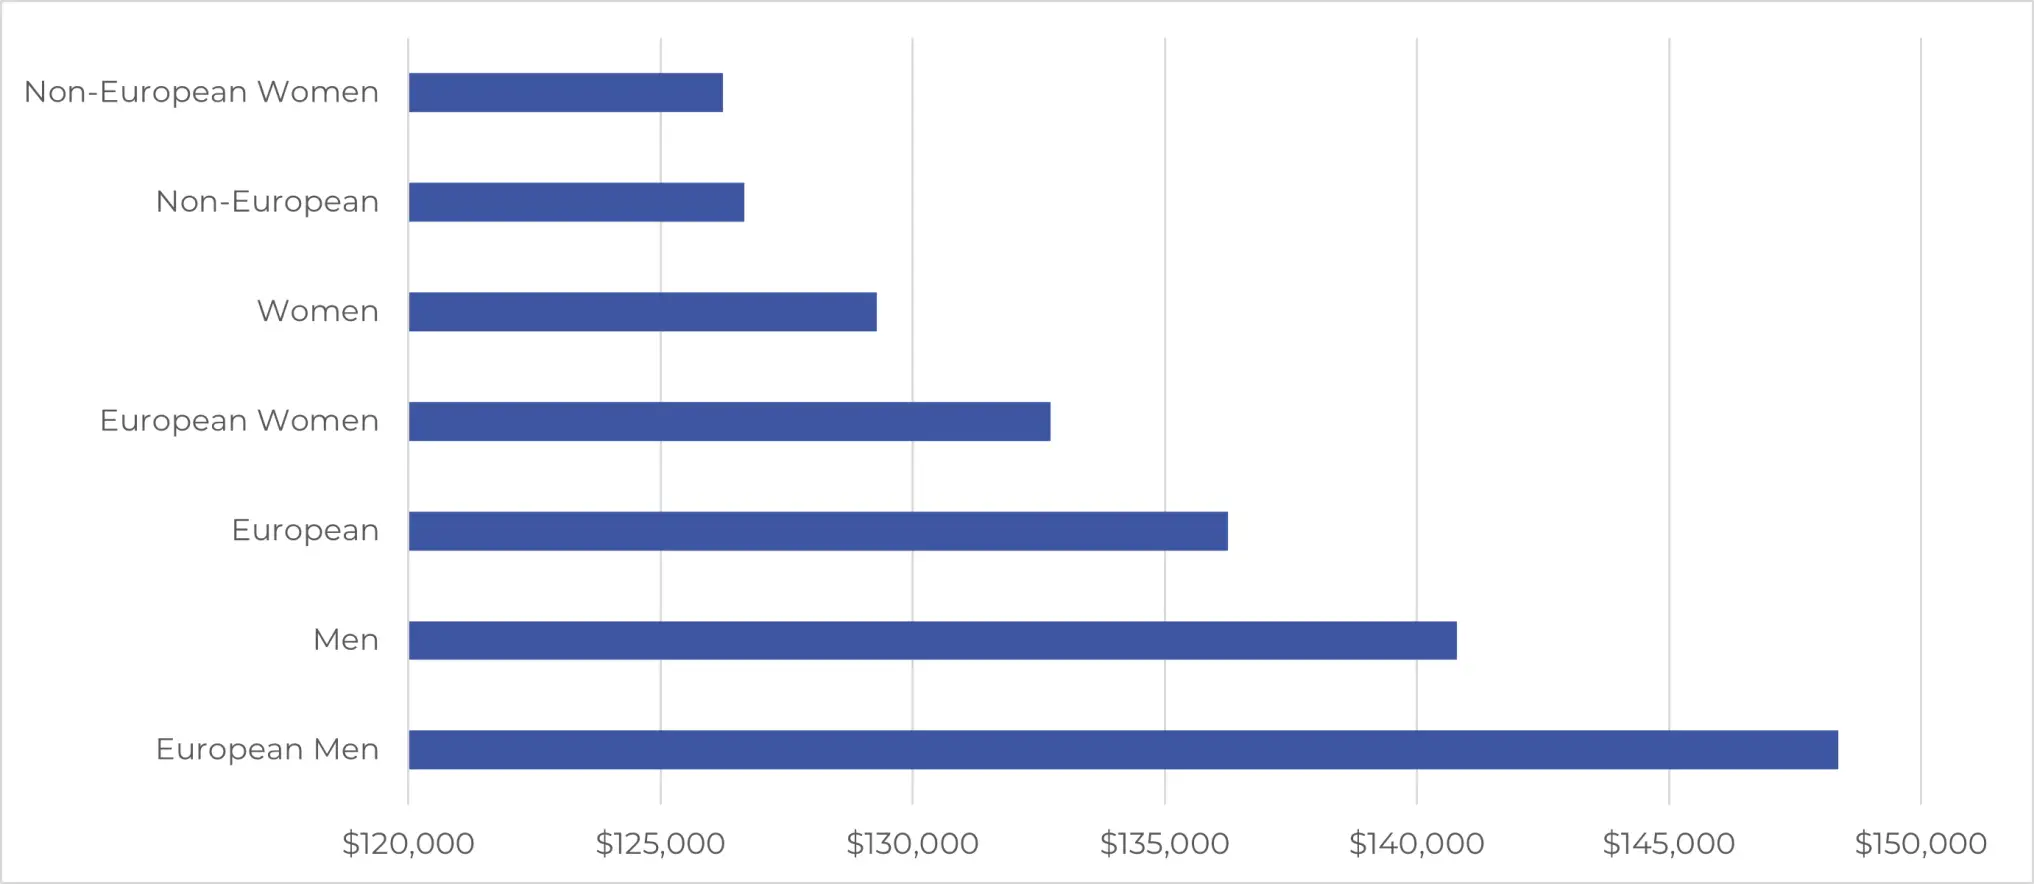
Average salary by gender and ethnicity
Due to our small size some gender and ethnicity groups have been aggregated, including Māori, Pacific peoples and non-European men.
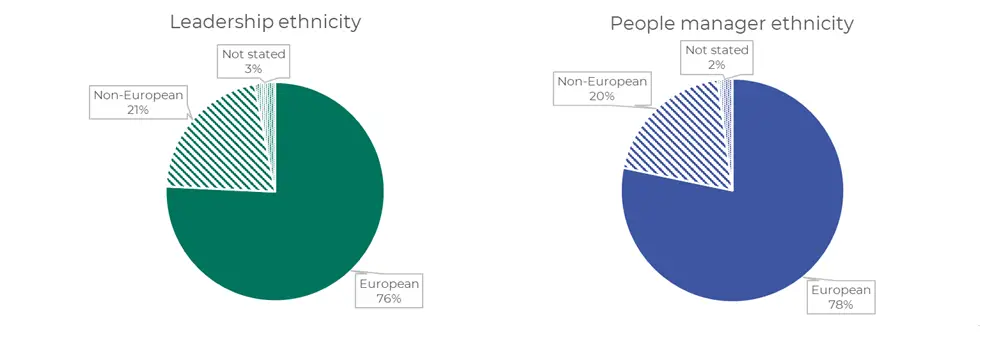
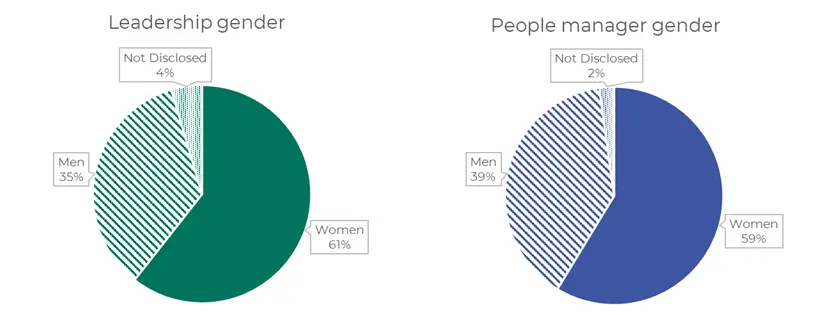
Representation in leadership
We recognise that leadership is not always about managing people. Thought leaders are those who provide expert advice. Thought leaders use their experience to influence and guide by providing insight into a specific topic. We have reported leadership including our principal advisors and technical leads. We have also reported people managers in a separate representation.
2% of people managers did not declare an ethnicity.