Pay gaps and workforce representation report: December 2023
Our people
Total employees: 169
| EMPLOYMENT STATUS | WOMEN | MEN | NOT DISCLOSED |
|---|---|---|---|
| Permanent | 102 | 51 | 2 |
| Fixed-term | 12 | 2 | n/a |
| Full-time | 99 | 47 | 2 |
| Part-time | 15 | 4 | n/a |
Pharmac ethnicity
We have a 92% ethnicity declaration rate. We have used a total response reporting method. This means people can appear more than once in our reporting, so ethnic group totals will add up to more than 100 percent of staff.

Pay gaps
We calculate gender pay gaps as recommended by Te Kawa Mataaho | Public Service Commission, the percentage difference in the average pay for women and men using full-time-equivalent total remuneration. Ethnicity pay gaps are also calculated using average pay.
Although we performed a thorough review of our pay equity, due to our small size, we are only able to report our gender and non-European/European ethnicity pay gaps.
Our Gender Pay Gap (GPG) is 6% | Our adjusted GPG by level is 0.7%.
Our ethnicity pay gap for Non-Europeans/Europeans is 12%, down from 17% in 2022.
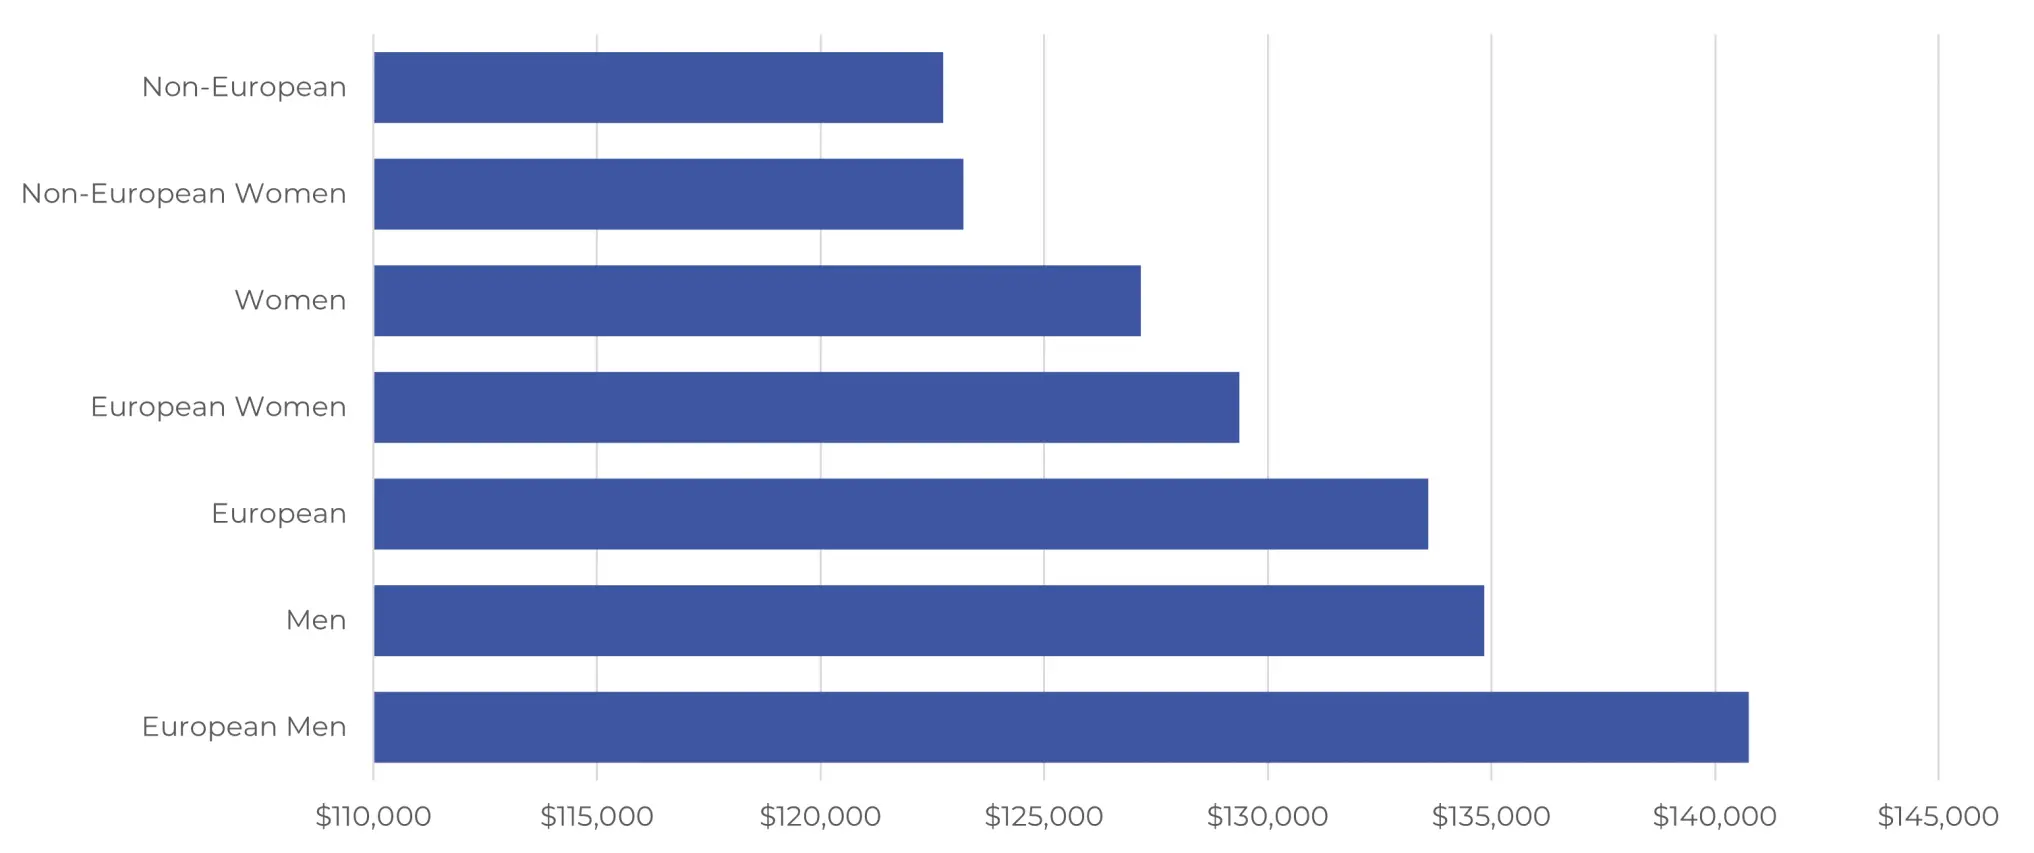
Average salary by gender and ethnicity
Due to small numbers some gender and ethnicity groups have been aggregated, including Māori, Pacific peoples and Non-European men.
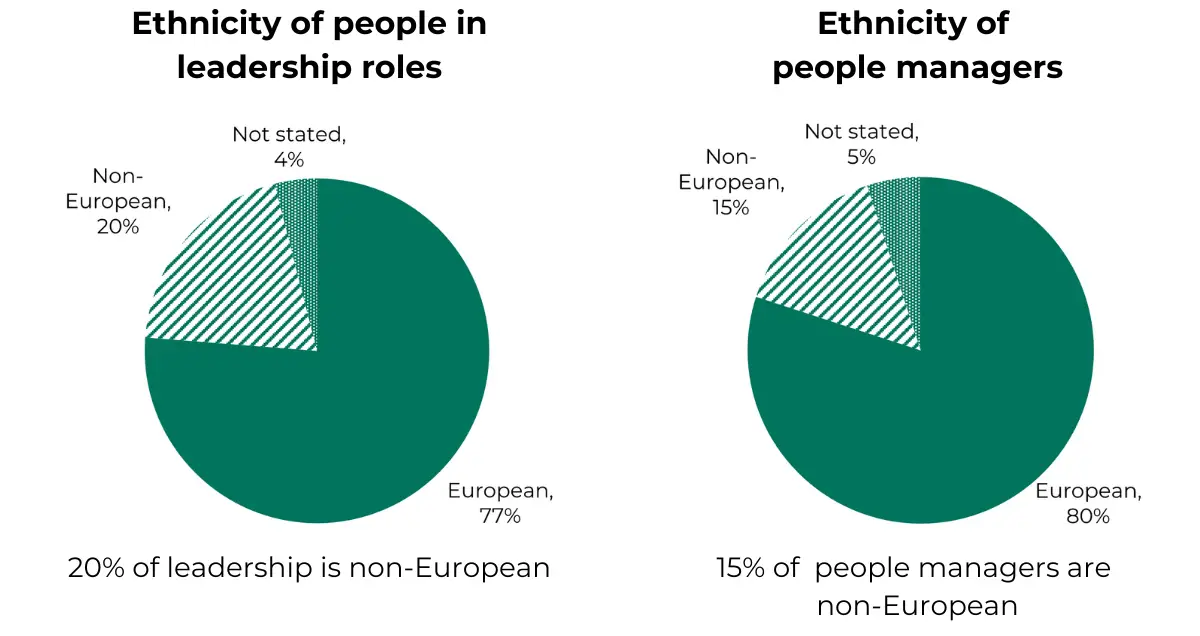
Representation in leadership
We recognise that leadership is not always about managing people. Thought leaders are those who provide expert advice. Thought leaders use their experience to influence and guide by providing insight into a specific topic. We have reported leadership including our thought leaders. We have also reported people managers in a separate representation.
By ethnicity
5% of people leaders did not declare an ethnicity.
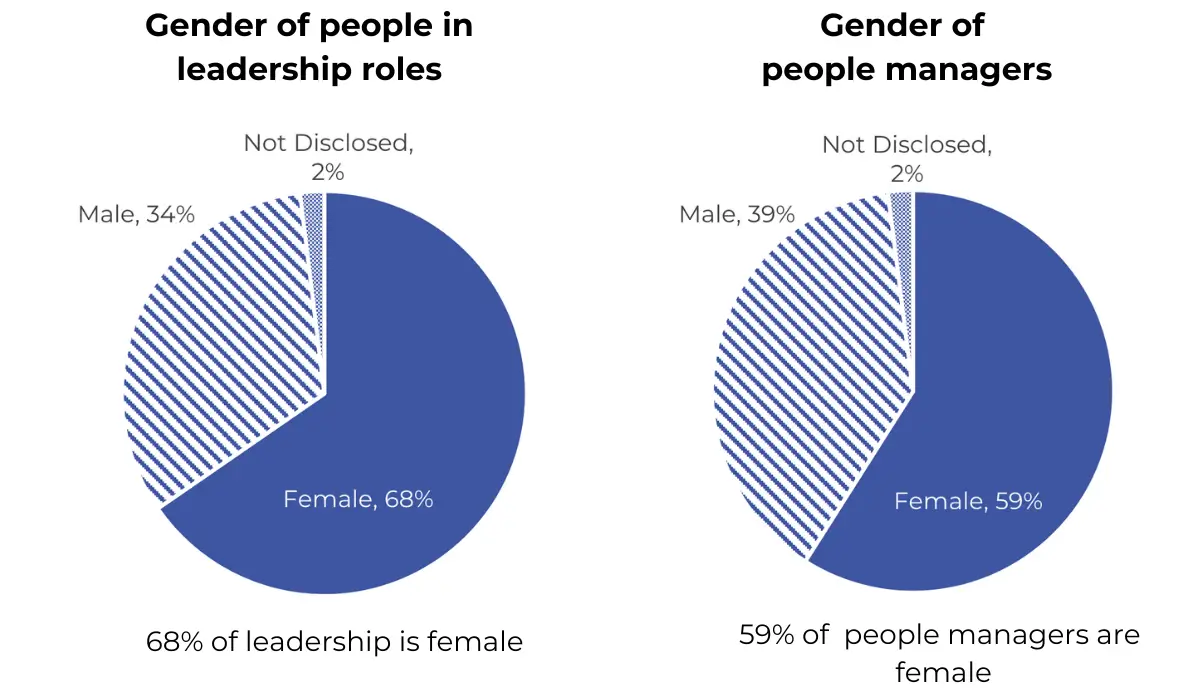
By Gender
Read the December 2022 Pay Equity Report